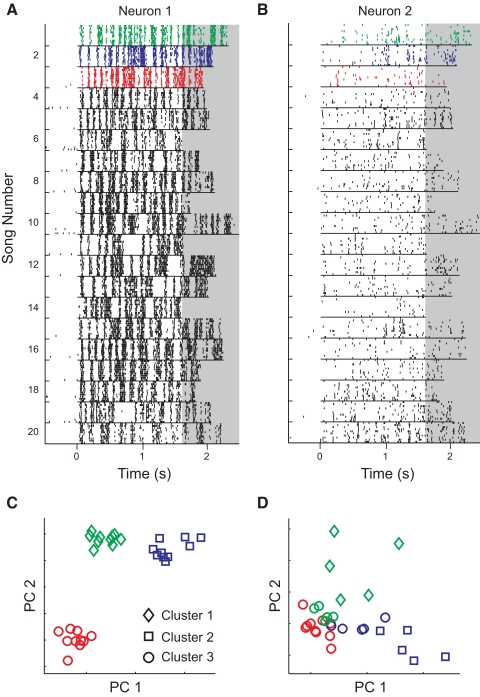
Fig. 2.
MLd neural responses discriminated among songs with a wide range of abilities. A: spike trains from a single neuron in response to 10 repetitions of 20 unique zebra finch songs. Each group of 10 lines shows the responses to 10 presentations of a single song. The songs were pseudorandomly interleaved during the experiment and the responses were organized here for visualization. For analysis, the spike trains were truncated to the duration of the shortest song (1.62 s; nonshaded region). B: spike trains from a second neuron in response to the same stimuli as in A. C: in the K-means and van Rossum metrics, spike trains were represented as points in a 1,620-dimensional space (one dimension for each millisecond of activity). For illustration, here the spikes in response to the first 3 songs were projected onto 2 dimensions (the first 2 principal components). Spike trains from song 1 are shown in green, song 2 in blue, and song 3 in red. The K-means algorithm was used to classify the spike trains into clusters based on spike train dissimilarity. The shape of the marker corresponds to cluster membership. For Neuron 1, spike trains evoked by each song belong to their own cluster, indicating high discriminability. D: for Neuron 2, cluster 3 contains spike trains from songs 1, 2, and 3, indicating that the spike trains produced by this neuron cannot perfectly discriminate among the 3 songs. Color and shape labels are the same as in C.

