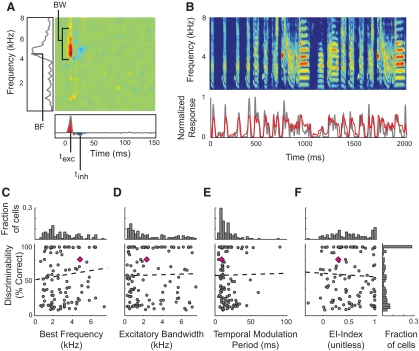
Fig. 4.
Neural discriminability was not correlated with spectral or temporal tuning. A: spectrotemporal receptive fields (STRFs) were calculated from neural responses to zebra finch song and estimates of the spectral and temporal tuning properties were computed from the STRF. The left panel shows the spectral projection of the STRF, from which we measured the best frequency (BF). Excitatory bandwidth (BW) was measured at the time of maximum excitation. The bottom panel shows the STRF's temporal projection, from which we measured the temporal modulation period (delay between the peaks of excitation and inhibition) and Excitatory–Inhibitory (EI) index, which was the normalized balance between excitation (shown in red) and inhibition (shown in blue). Positive values indicate stronger excitation than inhibition; negative values indicate stronger inhibition (range: −1 to 1). B: an example in which the STRF predicts the neural response to a novel sound (cc = 0.8; gray trace is the poststimulus time histogram (PSTH) of actual response; red trace is predicted response). C and D: discriminability is not correlated with best frequency (r = 0.11) or spectral bandwidth (r = 0.03). The top histograms in each panel show the distribution of BFs and BWs. E and F: discriminability is not correlated with the temporal modulation period (r = 0.01) or the EI index (r = −0.01). The right histogram shows the distribution of K-means discriminability, and corresponds to C–F. Dashed lines show the linear regression and the pink diamond represents the neuron from A.

