Fig. 6.
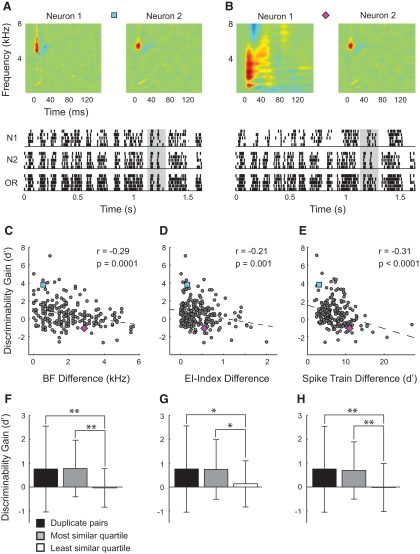
Pairs of neurons with similar tuning properties obtained the largest gains in discriminability. A: 2 neurons with highly similar STRFs. Below the STRFs are 5 spike trains evoked by a single song for each of the neurons, as well as the output of the OR readout neuron. The rasters are highly similar for the two input neurons, which is reflected in the readout neuron. The gray bar shows qualitatively the increased signal strength obtained by the readout neuron. B: pair of neurons with dissimilar STRFs. Neuron 2 is the same as in A, but Neuron 1 has different tuning. For this pair, misaligned spike trains do not reinforce one another (gray bar). C: the gain in discriminability is correlated with the similarity of frequency tuning. The pairs in A and B are shown as a blue square and purple diamond, respectively. D: similar temporal tuning is correlated with gains in discriminability. E: pairs of neurons that produce similar spike train patterns have larger gains in discriminability than pairs of neurons with dissimilar spike train patterns. For C–E, the dashed lines show the linear regression. F–H: for the 3 parameters plotted in C–E, the gain in discriminability for the quartile of neurons with the most similar tuning (gray) and least similar tuning (white). Black bars show the gain in discriminability for readout neurons that receive input from identically tuned neurons. Error bars are ±1SD (*P ≤ 0. 01, Kruskal–Wallis test; **P ≤ 0.0002, Kruskal–Wallis test).

