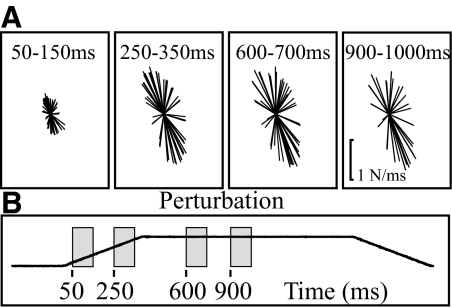
Fig. 5.
Horizontal force trajectories during different time epochs. Representative force traces of the right hindlimb (9/7) during 4 time periods (50–150, 250–350, 600–700, and 900–1,000 ms) are depicted. All forces were graphed on the same scale across experiments and conditions. The force constraint or shape index appears to be maintained through the time periods. However, the amplitude is affected by time. Shape index and principal directions were further quantified for this and 2 additional experiments and are presented in Table 1.

