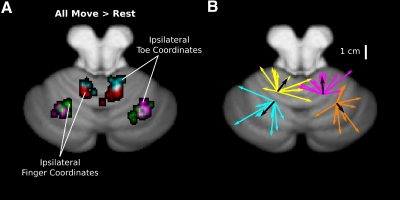
Fig. 4.
Somatotopic organization of activity. A: the clusters of center of mass during ipsilateral hand and foot movements collapsed over simple and complex movements. Red and cyan clusters show the distribution of peak activities in the anterior lobes for finger and toe activity, respectively. Purple and green clusters show peaks for the finger and toe conditions in the lateral hemispheres. B: vectors indicate individual (colored) and group averaged (black) shifts from finger to toe center of activation for the data shown in A. The origins are centered on the mean x, y, z position of activity for ipsilateral finger movements.

