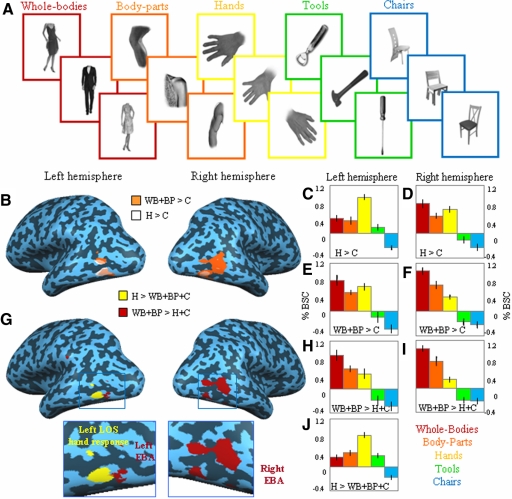
Fig. 1.
Stimuli, averaged statistical maps and activation levels in experiment 1. A: exemplars of stimuli used in experiment 1: whole bodies, body parts, hands, tools, and chairs. B: group analysis results are shown in the right and left hemisphere of a single subject for the comparison of hands vs. chairs (H > C, shown in white) and for whole body and body parts vs. chairs (WB + BP > C, shown in orange). C–F: average peak activity (percentage bold signal change [%BSC]) for each stimulus category extracted from individual-subject brain areas functionally localized with the comparisons illustrated in B. Error bars represent SEs. G: group analysis results are shown in the right and left hemispheres of a single subject for the more selective comparison of hands vs. whole bodies, body parts, and chairs (H > WB + BP + C, shown in yellow) and for whole bodies and body parts vs. hands and chairs (WB + BP > H + C, shown in red). H–J: average peak activity (%BSC) for each stimulus category in the individual-subject brain areas localized with the comparisons illustrated in G. Error bars represent SEs.

