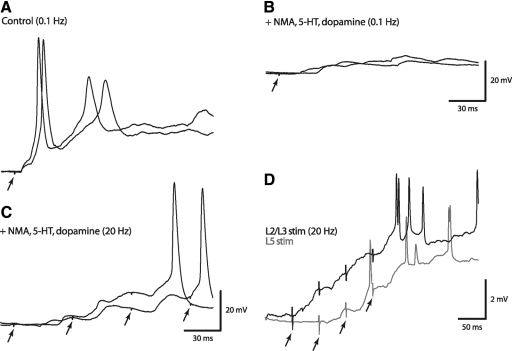
Fig. 6.
The rhythmogenic cocktail significantly reduced the amplitude and increased the latency of DR-evoked EPSPs in L2/L3 Hb9 INs. A: low-intensity L2 dorsal root stimuli (2T, 0.1 Hz) produced short-latency (5.2 ms) stable EPSPs that reached action potential threshold. The traces shown in all panels are sequential responses. Resting membrane potential: −53 to −55 mV. B: exposure to the rhythmogenic cocktail significantly reduced the amplitude and increased the latency of evoked EPSPs in the same neurons shown in A. This example demonstrates the most significant effects of the cocktail recorded in our experiments. Membrane depolarization of 3–5 mV (membrane potential was approximately −50 mV) was recorded in the presence of the cocktail. Location of traces in this panel does not reflect the actual membrane potential. C: in a different Hb9 IN, in the presence of the mixture of neurotransmitter agonists, action potentials were generated only after the summation of EPSCs during L3 dorsal root stimulation at high frequency (20 Hz, arrows). D: flexor- (L2/L3) and extensor- (L5) related DR stimuli during neurochemically induced rhythmic activity in Hb9 INs. The traces are the averaged responses of all Hb9 INs (n = 13) to a train of afferent stimuli (arrows, 4 stimuli at 20 Hz) during the interburst phase of the cycle period. L2/L3 stimuli (black, n = 6 neurons) generated shorter-latency EPSPs than those produced by L5 stimuli (gray, n = 7 neurons). Membrane potentials varied from −50 to −60 mV.

