Fig. 3.
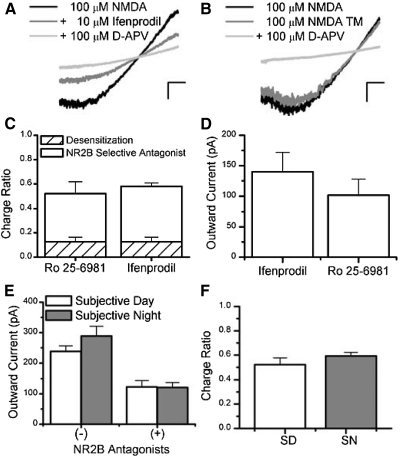
NMDARs containing NR2B subunits contribute to NMDAR current within the mouse SCN. A: a representative I-V plot derived from a patch-clamped ventral-lateral SCN neuron that was subjected to voltage ramps in the presence of 100 μM NMDA (black), supplemented with 10 μM ifenprodil (charcol) and 100 μM d-2-amino-5-phosphonovaleric acid (d-APV, gray). B: a representative I-V plot from a similar experiment as in A but with ifenprodil omitted, as a time-matched control (TM). C: this bar graph shows the average proportion of the charge (±SE) blocked by NR2B-selective antagonists, Ro 25-6981 (3.5 μM, n = 5) and ifenprodil (10 μM, n = 33), and the degree of desensitization that occurred in SCN neurons in similar “0” [Mg]o solutions omitting these antagonists (hatched bars, n = 12). D: this bar graph shows the mean outward NMDAR currents at 50 mV (±SE) for cells treated with ifenprodil (10 μM, n = 6) or Ro 25-6981 (3.5 μM, n = 5) recorded during the SD. E: the average outward NMDAR currents (±SE) treated with NMDA alone (minus) and with NR2B antagonists (plus) are compared during the SD (n = 11) and SN (n = 27) recordings. F: the charge ratio of the integrated NMDAR current sensitive to NR2B antagonists relative to the total integrated NMDAR current is plotted for SD (n = 11) and SN (n = 27) recordings. The scale is set to A and B is 20 mV (horizontal bar) and 100 pA (vertical bar).

