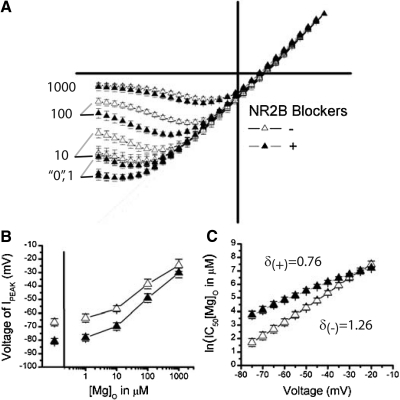
Fig. 6.
NMDAR currents exhibit less [Mg]o block in the presence of NR2B blockers than in their absence. A: the scaled mean I-V curves (±SE) are superimposed to contrast recordings in the presence (+) and absence (−) of NR2B antagonists for 0, 1, 10, 100, 1,000 μM [Mg]o. B: the average voltage that elicited the peak inward current is plotted as a function of [Mg]o for cells treated with (+, n = 19) or without (−, n = 24) NR2B antagonists. C: the mean IC50 (natural log) of [Mg]o (±SE) is plotted as a function of voltage (mV) for conditions with (+, n = 16) or without (−, n = 24) NR2B antagonists. The proportionality constants are displayed for their respective conditions.

