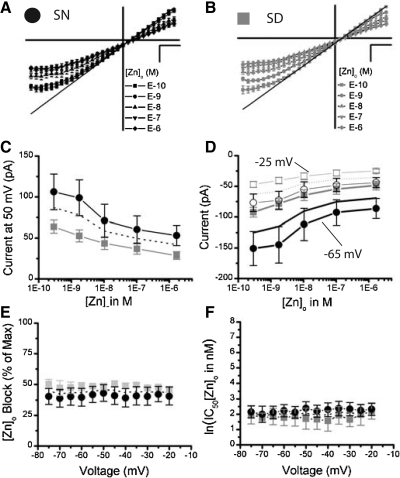
Fig. 7.
NMDAR currents insensitive to NR2B blockers are significantly reduced by the NR2A antagonist, [Zn]o, within the mouse SCN. The NMDAR I-Vs are plotted as a mean (±SE) where each cell was scaled to its largest outward current at 50 mV, for all [Zn]o conditions (E-6, E-7, E-8, E-9, E-10 M) treated with 10 μM ifenprodil and 1 μM [Mg]o in experiments conducted during the SN (A, n = 6) and SD (B, n = 5). C: the mean outward NMDAR currents (±SE) at 50 mV are plotted as a function of [Zn]o for the SN (black circles, n = 6) and SD (gray squares, n = 5) conditions. D: the mean inward NMDAR currents (±SE) at −25 mV (empty) and −65 mV (filled) are plotted as a function of [Zn]o for the SN (circle, n = 6) and SD (square, n = 5). E: the mean percent of the total NMDAR current blocked by [Zn]o (±SE) is plotted as a function of voltage (mV). F: the mean IC50 (natural log) of [Zn]o (±SE) is plotted as a function of voltage (mV) for the SN (black circles) and SD (gray squares) conditions. The mean IC50 for [Zn]o across voltage is 9.3 and 6.2 nM for the SN and SD recordings, respectively.

