
Figure 4. IFN mRNA expression in AS and healthy control subjects.
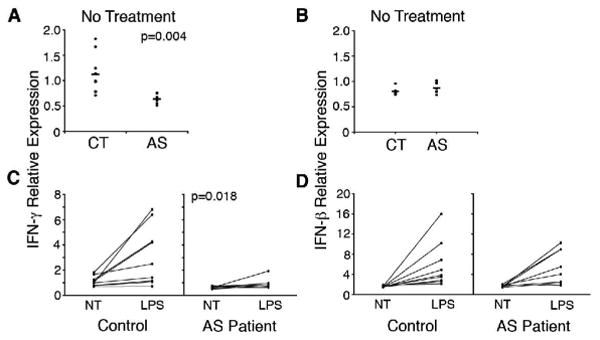
Comparison of IFN-γ (A) and IFN-β (B) mRNA expression levels from microarray data in untreated macrophages from healthy controls (CT), and AS patients (AS). Comparison of IFN-γ (C) and IFN-β (D) mRNA expression levels in untreated and LPS stimulated (10 ng/ml, 3 h) macrophages from healthy controls (Control), and AS patients.