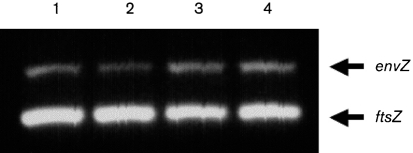
Fig. 1.
Transcriptional analysis of envZ expression in wild-type and ompR strains. The analysis was done on cDNAs from cultures grown in pH 7.0 LB broth, with either no added NaCl or 400 mM added NaCl. Multiplex PCRs were set up with EnvZ1 and EnvZ2 primers to amplify a 424 bp envZ product, and EcFtsZ1 and EcFtsZ2 primers to amplify a 302 bp ftsZ product (Schwan et al., 2002). Each multiplex was run three separate times. The lanes were loaded as follows: 1, NU149 (pH 7.0); 2, NU149 OmpR1 (pH 7.0); 3, NU149 (pH 7.0, 400 mM NaCl); and 4, NU149 OmpR1 (pH 7.0, 400 mM NaCl). Quantification of the data was done using ImageQuant software (Molecular Dynamics), and the number of pixels for each band was quantified. For each lane, the intensities of the envZ product were corrected to the intensity of the ftsZ band.

