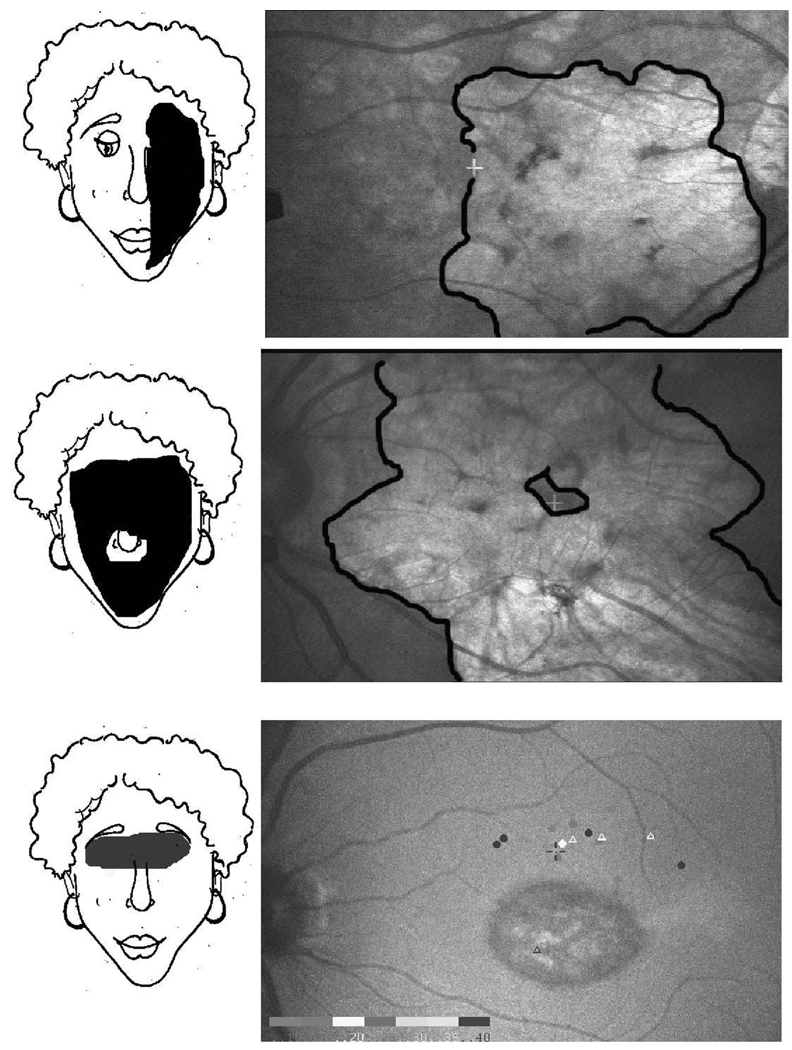
Figure 1.
Examples of face field findings. On the left are schematics of the face field findings, and on the right are SLO images showing fixation (white cross in top and middle, dark cross above atrophy in bottom). Fundus images are the same right and left as the visual field space. Superior and inferior are inverted relative to the visual field space. Top: Geographic atrophy from age-related macular degeneration. Visual acuity 20/160. The person looked to the right to see my nose. My face to her right was blurred. Middle: Geographic atrophy from age-related macular degeneration. Visual acuity 20/50. The person only saw a tiny part of my nose and nostrils; the rest was blurred. Bottom: Stargardt’s disease. Visual acuity 20/160. My eyes were missing.

