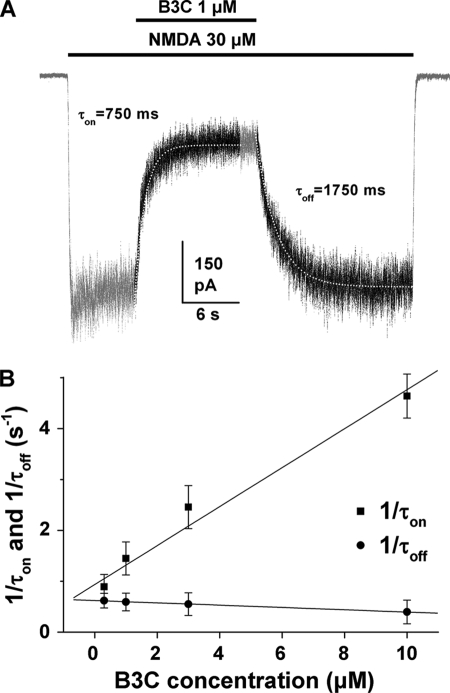
FIGURE 4.
Onset and offset time constants of bis(propyl)-cognitin inhibition. A, traces show currents activated by 30 μm NMDA and its inhibition by 1 μm bis(propyl)-cognitin applied after the activation of NMDA receptors. The periods of drug application are indicated by the solid bar above the trace. White dotted lines drawn through the current trace (black part) are the theoretical fit of onset (τon) and offset (τoff) of bis(propyl)-cognitin inhibition using single exponential functions. B, graph plotting average τon (■) and τoff (●) values against bis(propyl)-cognitin concentration shows the concentration dependence of onset and offset kinetics. Error bars, S.E.

