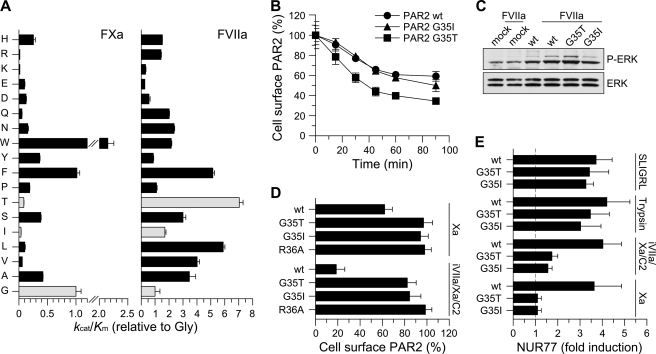
FIGURE 4.
Substitution of the P2 position in PAR2 generates TF·FVIIa signaling selectivity. A, the P2 preference of FXa (left panel) was determined as described under “Experimental Procedures.” The apparent kcat/Km value for hydrolysis of each sub-library by FXa is shown relative to that for the P2-Gly sub-library (error bars represent ±S.D.). The P2 preference of sTF·FVIIa described in Larsen et al. (29) and determined under identical conditions is included for comparison (right panel). Light-colored bars highlight the preference of sTF·FVIIa for P2-Gly, Thr, and Ile. B, cleavage of wt PAR2 (circles) or P2 variants G35I (triangles) and G35T (squares) was determined by measuring residual receptor exposure in CHO-TF cells transiently transfected with FLAG-tagged receptors following incubation with 20 nm wt FVIIa for the indicated times (mean ± S.D., n = 4). No difference in PAR2 surface exposure was observed between wt and mutant receptors (surface expression of unstimulated cells 75 ± 6 (wt), 75 ± 4 (G35I), and 81 ± 10 (G35T) arbitrary absorbance units). C, FVIIa-induced signaling by wtFLAG-PAR2, G35I, and G35T was determined by stimulating transiently transfected CHO-TF cells with 10 nm wt FVIIa for 10 min followed by Western blot quantification of phosphor-ERK1/2 (αP-ERK), (mean -fold increases, n = 2). D, the effect of G35I and G35T substitutions on the cleavage of FLAG-PAR2 by free FXa (100 nm) or the NAPc2-stabilized ternary complex formed by 5 nm FVIIa S195A FVIIa (iFVIIa), 50 nm FXa, and 150 nm NAPc2. The cleavage-resistant PAR2 variant R36A was included for comparison (light-colored bar). Transiently transfected CHO-TF cells were incubated with FXa (1 h) or NAPc2-stabilized ternary complex (30 min) followed by measurement of residual surface exposed FLAG-PAR2 relative to unstimulated cells (mean ± S.D., n = 9). E, FXa- and ternary complex-induced signaling by FLAG-PAR2 G35I and G35T was determined in serum-starved, transiently transfected mouse PAR1-deficient M6-11 fibroblasts. Cells were stimulated for 90 min with FXa (100 nm), the ternary complex (iFVIIa, FXa, and NAPc2 at 5, 50, and 150 nm, respectively), trypsin (10 nm), or the PAR2 agonist peptide (SLIGRL, 100 μm). Induction of NUR77 mRNA was quantified by real-time PCR (mean ± S.D., n = 11).

