FIGURE 8.
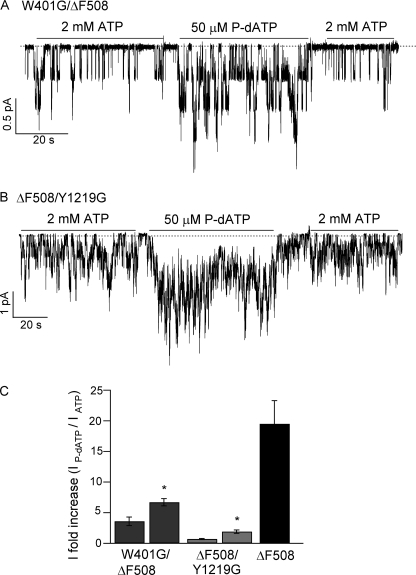
P-dATP effect on W401G/ΔF508-CFTR and ΔF508/Y1219G-CFTR. Representative current traces of W401G/ΔF508 (A) and ΔF508/Y1219G (B) in the presence of 50 μm P-dATP. C, summary of the maximum current -fold increase in activity induced by 10 μm and 50 μm P-dATP in W401F/ΔF508 and ΔF508/Y1219G, and 10 μm P-dATP in ΔF508. *, p < 0.01 versus 10 μm P-dATP (n = 5–13).

