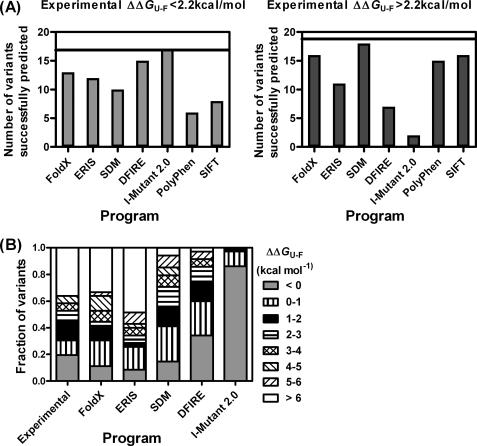
FIGURE 6.
Comparison of experimental results and prediction methods. A, the mutations are divided into two groups according to whether they were destabilizing by less than or more than 2.2 kcal mol−1 (as determined by experiment). The prediction methods (FoldX, DFIRE, SDM, ERIS, I-Mutant 2.0, SIFT, and PolyPhen) were then scored for each mutant depending on whether they fell into the correct category. B, the mutations are grouped according to the changes in stability: stabilizing mutations are in gray; all the other bands are destabilizing by: 0–1 kcal mol−1 (vertical stripes), 1–2 kcal mol−1 (black), 2–3 kcal mol−1 (horizontal stripes), 3–4 kcal mol−1 (hatched), 4–5 kcal mol−1 (right diagonal stripes), 5–6 kcal mol−1 (left diagonal stripes), and >6 kcal mol−1 (including those variants that were expressed in the insoluble fraction) (white).

