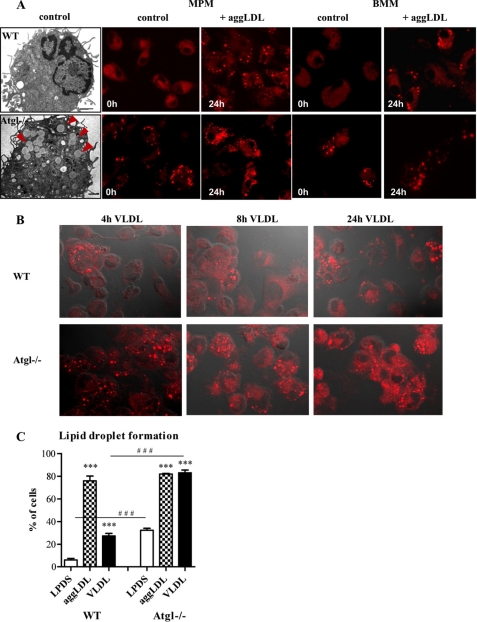
FIGURE 3.
Lipid droplets in Atgl−/− and WT macrophages. A, electron microscopy images of an Atgl−/− and WT macrophage. Lipid droplets in the Atgl−/− macrophage are indicated by arrowheads. A and B, fluorescent microscopy images after Nile Red staining of Atgl−/− and WT MPM, BMM, and macrophages incubated with 100 μg of aggLDL/ml for 24 h (A) or MPM incubated with 100 μg of VLDL/ml for 4, 8 and 24 h (B). Scale bar in electron microscopy images applies to 1 μm. Fluorescence images: original magnification, ×63. C, quantification of lipid droplet-containing cells in MPM cultivated in LPDS or after incubation with aggLDL or VLDL for 24 h. Data are presented as the mean percent ± S.E. of foamy-like cells from at least 150 cells per group. ***, p ≤ 0.001; ###, p ≤ 0.001.

