FIGURE 4.
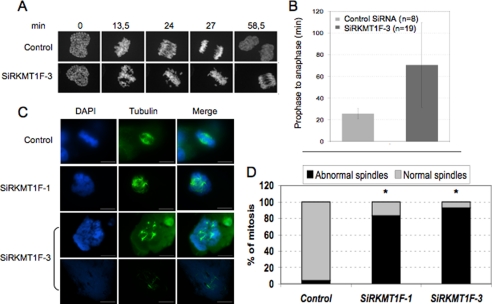
KMT1F depletion delays mitosis. A, live cell confocal imaging of HeLa cells expressing a fusion GFP-H2B vector and transfected either with KMT1F-SiR3 or a control siRNA. B, the duration of mitosis from prophase to anaphase is indicated for each condition. The histograms represent the data collected from 27 cells and 27 different movies. A representative example is shown in the supplemental information. The bars indicate the standard deviations. C, indirect immunofluorescence with anti-β-tubulin antibody in 293T cells, 4 days after transient transfection with two KMT1F siRNA (SiRKMT1F-1 and SiRKMT1F-3) or a control siRNA. KMT1F depletion increases the number of cells containing abnormal spindle and multi-asters. D, histograms represent the rate of mitotic figures with either normal or abnormal spindle in 293T cells transfected with a control siRNA (3250 cells analyzed, n = 100 cells in metaphasis, 1.53% of necrotic cells), SiRKMT1F-1 (1386 cells analyzed, n = 6 cells in metaphases, 58% of necrotic cells), and SiRKMT1F-3 (852 cells analyzed, n = 55 cells in metaphasis, 2% of necrotic cells). The significant differences are indicated with asterisks (*, p < 0.001). The p values were calculated using a t test.

