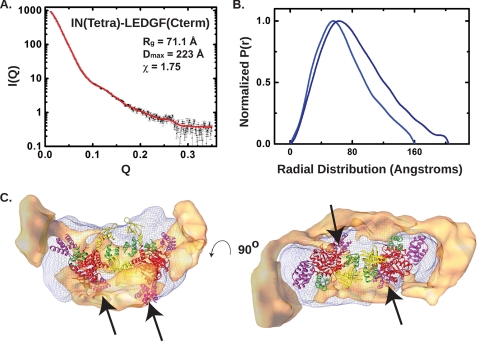
FIGURE 5.
SAXS analysis of IN(tetra)·LEDGF(Cterm). A, small angle scattering data from IN(tetra)·LEDGF(Cterm). Shown in black squares is the recorded intensity as a function of Q. Plotted against these data is the fit derived from Gasbor analysis (red lines). B, experimental P(r) shape functions for IN(tetra)·LEDGF(IBD) (light blue) and IN(tetra)·LEDGF(Cterm) (dark blue). C, volume difference between the DAMMIF-derived envelopes for IN(tetra)·LEDGF(IBD) and IN(tetra)·LEDGF(Cterm), rendered as a tan solid in orthogonal views. Two additional IBDs were added to model 1, and the resulting 4:4 IN:LEDGF complex was docked into the envelope exactly as shown in Fig. 4. The difference density is located near bound LEDGF molecules and could account for the flanking residues in LEDGF(Cterm) not present in IN(tetra)·LEDGF(IBD).

