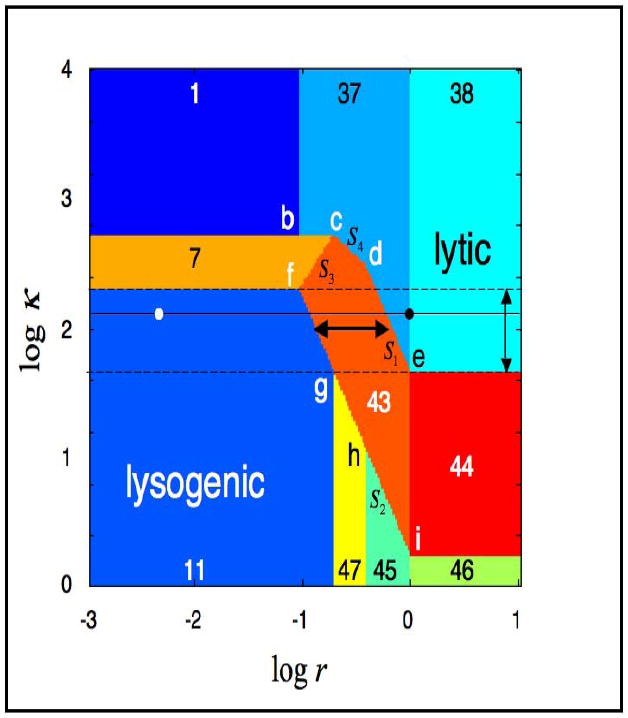
Fig. 3.

System design space for the model in Fig. 1. The units of the axes are log base 10. The regions of different color represent qualitatively different phenotypes. The regions are numbered arbitrarily. The letters b through i represent the coordinates of the intersections, and the slopes are labeled S1 through S4. The white dot represents the location of the wild-type system in the lysogenic state; the black dot represents the location of the system in the lytic state. Induction, caused by an increase in logr, corresponds to rightward movement along the horizontal black line. Regions 7, 43 and 44 represent hysteretic behavior with three steady states, one unstable and two stable, corresponding to the two neighboring stable regions. Wild-type induction occurs across the critical hysteretic region (horizontal arrow). The value of logκ must lie between the dashed lines (vertical arrow) in order to maintain the temperate life cycle operating across the critical hysteretic region.
