Fig 1.
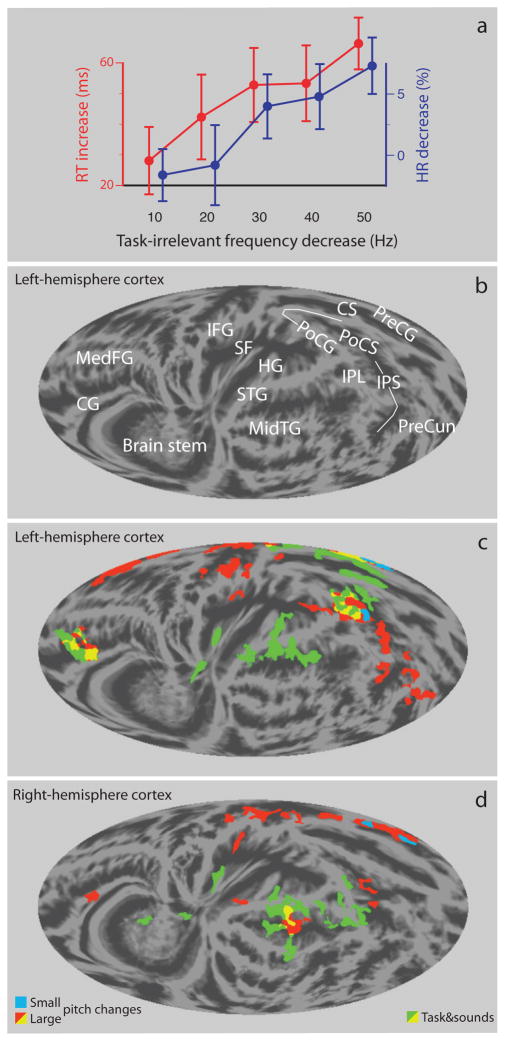
Cortical networks of focused and distracted behavior. (a) Distraction of performance (within-subject difference in performance between infrequent pitch change and frequent sound) in the loudness-discrimination task. Mean reaction time (RT, red line) increased and hit rate (HR, blue line) decreased with the increasing magnitude of task-irrelevant pitch change (error bars show s.e.m.). (b) Anatomical landmarks for the left-hemisphere cortical surface (for abbreviations, see text). (c, d) Left- and right-hemisphere cortical activations (N=10; threshold Z > 2.3, corrected cluster threshold P < 0.01) overlaid onto grand-average cortical anatomy. Green = Activations associated with focused discrimination-task performance. Red = Activations to large (≥ 30 Hz) task-irrelevant pitch changes. Light blue = Activations to small pitch changes (≤ 20 Hz). Yellow = Areas activated by both the discrimination task and large distracting pitch changes.

