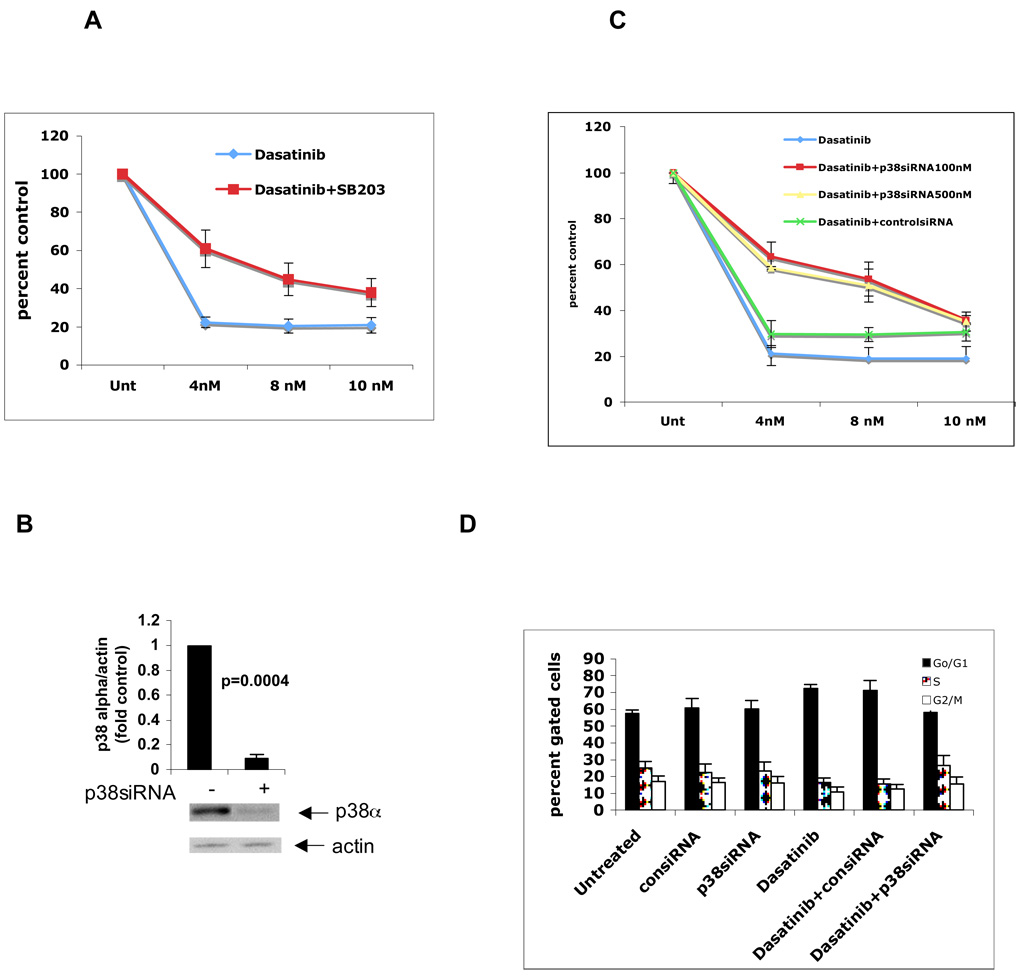
Fig 4. Inhibition of p38 Map Kinase partially reverses the anti-proliferative effect and cell cycle arrest induced by dasatinib in BAF3/p210 cells.
A. BAF3/p210 cells were incubated with different doses of dasatinib in the presence or absence of SBS203580 (10 µM) for 48 hrs as indicated. Cell proliferation was assessed using XTT assays. Figure represents mean of 4 different experiments. Percent control was calculated by dividing observed value by untreated value × 100. (ANOVA: Two-Factor With Replication, p=0.019). B. BAF3/p210 cells were transfected with p38siRNA at 100nm concentrations as per Amaxa protocol. Equal amounts of total cell lysates (50µg/lane) were analyzed by SDS-PAGE and immunoblotted with antibody against the p38α isoform. The blot was then stripped and reprobed with an antibody against actin to control for protein loading. The signals for p38∝ and actin from three independent experiments (including the one shown in B) were quantitated by densitometry, and the intensity of expression of p38∝ relative to actin expression was calculated. Data are expressed as the fold increase of the mean of ratios of p38∝ to actin levels in p38siRNA transfected vs. untreated samples ±S.E. for each experimental condition. (untreated vs p38siRNA, paired t-test, p=0.0004). C. BAF3/p210 cells were incubated with different doses of dasatinib in the presence or absence of control or p38 siRNA transfection for 48 hrs as indicated. Cell proliferation was assessed using XTT assays. Figure represents mean of 3 different experiments. (ANOVA: Two-Factor With Replication, dasatinib vs. dasatinib + p38siRNA100nM, p=0.09; dasatinib vs. dasatinib +p38siRNA500nM, p=0.01). D. BAF3/p210 cells were incubated with dasatinib (1nM) and/or transfected with control or p38 siRNA (100nM) for 48 hrs as indicated. Cell cycle analysis was done using PI staining. Figure represents mean of 4 different experiments. (2-tailed paired t-test, dasatinib vs. dasatinib+p38siRNA, p=0.01).

