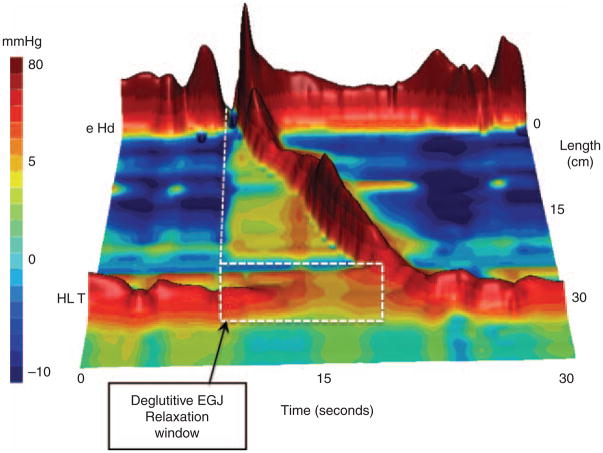
Figure 1.
Typical swallow pressure topography spanning from the pharynx to stomach of a normal subject with normal peristalsis and normal EGJ relaxation imaged as a landscape plot with elevation proportional to the magnitude of intraluminal pressure. As such, the peristaltic contraction appears as a ridge progressing from the upper sphincter to the EGJ over a span of about 10 s. Crucial in the interpretation of pressure topography plots is the assessment of deglutitive EGJ relaxation. This calculation is made within the highlighted rectangular area spanning across the EGJ from the time of the swallow to the arrival of the peristaltic contraction by the method summarized in Figure 2. EGJ, esophagogastric junction.

