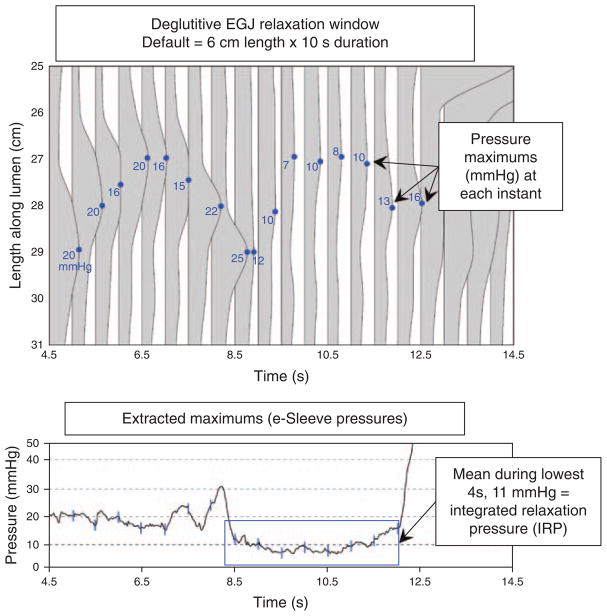
Figure 2.
Detail of the deglutitive EGJ relaxation window illustrating the derivation of the integrated relaxation pressure (IRP). The top panel illustrates a series of pressure profiles across spanning the EGJ at 0.2 s intervals and the blue dot on each indicates the location and magnitude of the greatest pressure along each pressure profile. The lower panel graphs these extracted maximums (blue lines) along with the intermediate values that are not shown in the upper panel. The IRP requires persistence of EGJ relaxation for 4 s within the relaxation window, but the actual time periods that go into its calculation (blue box) can be contiguous, as in this example, or non-contiguous. The IRP was selected as the standard metric for EGJ relaxation because it best differentiated the impaired EGJ relaxation in achalasia from non-achalasic individuals. Adapted from Ghosh et al. (6). EGJ, esophagogastric junction.

