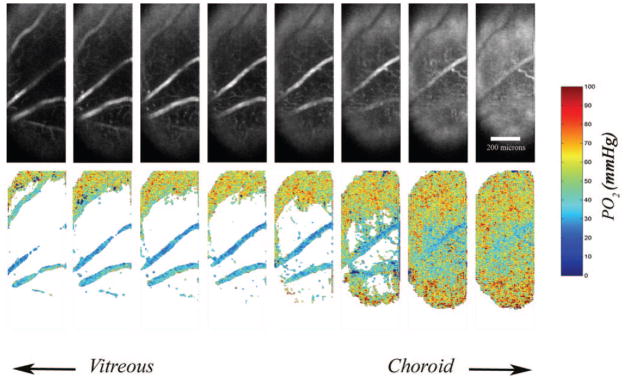
Figure 4.
Phase-delayed phosphorescence intensity images were analyzed by customized computer software to generate three-dimensional oxygen-tension maps. Top: three-dimensional phosphorescence intensity images at zero phase delay. Bottom: three-dimensional oxygen-tension maps allowed visualization and quantitative measurement of oxygen tension in the chorioretinal vasculatures. On the top portion of the oxygen-tension maps, in layers closer to the vitreous, a sampling of choroidal oxygen tension can be observed because of the curvature of the globe.

