Figure 6.

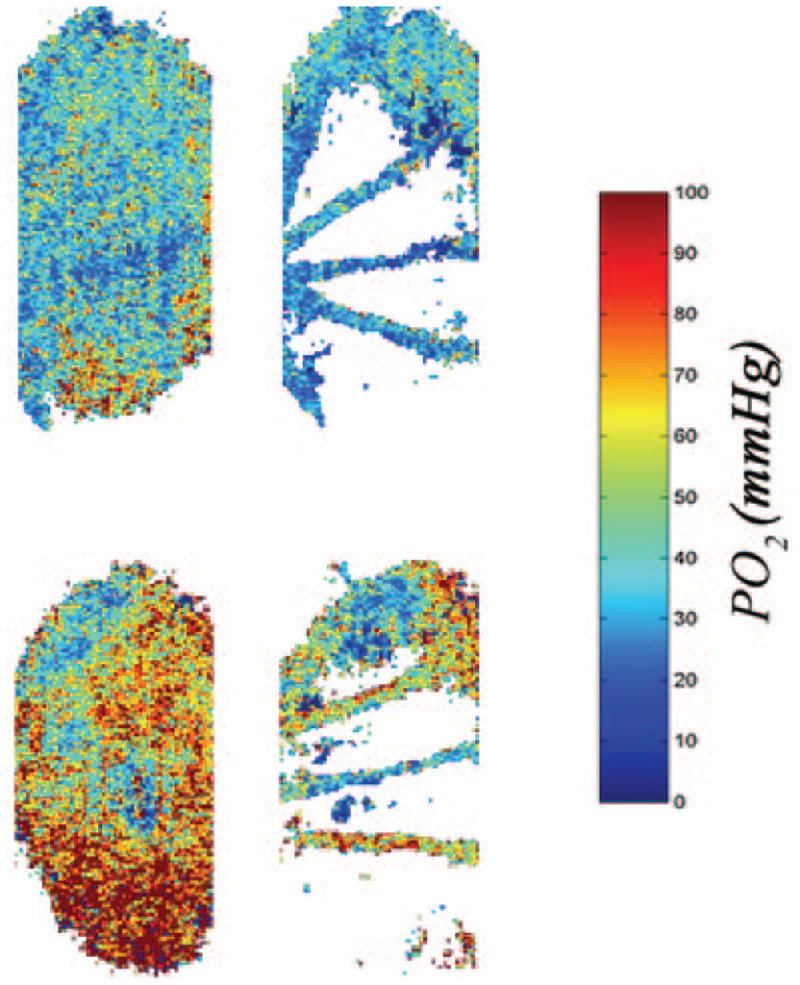
Typical oxygen-tension maps generated in a rat under hypoxia (top) and normoxia (bottom). Oxygen-tension changes in the choroid (left) and retinal artery and vein (right) can be visualized.

Typical oxygen-tension maps generated in a rat under hypoxia (top) and normoxia (bottom). Oxygen-tension changes in the choroid (left) and retinal artery and vein (right) can be visualized.