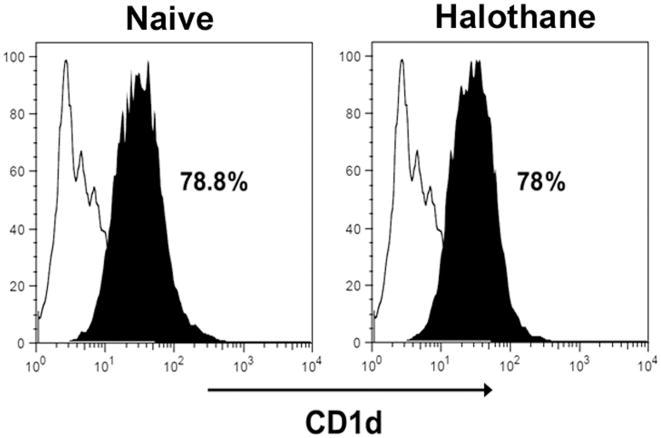
Figure 5.
Cell surface expression of CD1d by hepatocytes. Female WT mice were treated with nothing (naïve) or halothane, and hepatocytes were isolated at 4 h later. The cells were stained with PE-conjugated anti-CD1d antibody and analyzed by flow cytometry. Data are displayed as histograms depicting fluorescence intensity (x-axis) versus cell number (y-axis). Solid black lines represent isotype control antibodies and shaded histograms represent specific CD1d staining. The percentage of hepatocytes that express CD1d is presented in each graph. Data shown are representative of 3 mice per group.

