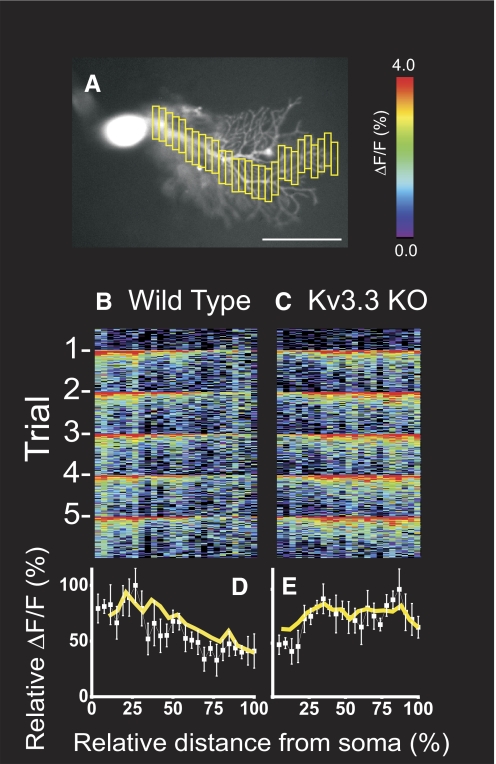
Fig. 6.
Line scan analysis of Ca2+ signals in proximal and distal dendrites of Kv3.3 KO PCs. A: example of line scan analysis in which relative fluorescence changes were quantified within successive dendritic segments (yellow boxes) extending from the junction with the soma to terminal dendrites. Scale bar is 50 μm. B and C: line scan analysis of Ca2+ signals from PCs oriented from proximal to distal dendrites. Abscissa is relative position along a continuous dendritic projection from junction with the soma (0) to most distal branches (100); ordinate is time in 15 ms measurements progressing from top to bottom of the panel. Five stimuli at 1 Hz were given over the course of the experiment. The warmer pixels occurred at the times of CF stimulation. D and E: plots of Ca2+ signals vs. distance along the dendrites showing the average of trials for the PCs depicted above (white boxes with SD error bars) and population averages (yellow lines; n = 4 wild-type, n = 6 Kv3.3 KO). Ordinate is relative Ca2+ signal normalized to maximum ΔF/F for each cell. These data demonstrate reduction of CF evoked Ca2+ signals from proximal to distal dendrites in wild-type PCs and sustained or augmented signals in distal dendrites of Kv3.3 KO PCs.

