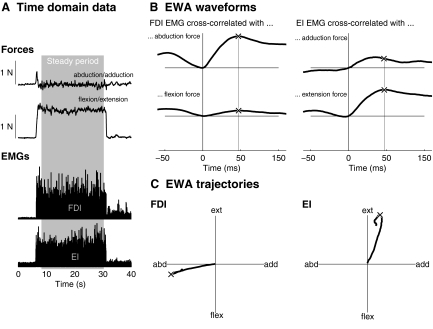
Fig.2.
Representative EWA. A: a sample trial is shown in the time domain, where the subject exerted primarily a metacarpophalangeal (MCP) extension force, which produced EMG activity in both the 1st dorsal interosseous (FDI) and extensor indicis (EI) muscles. B: cross-correlation of rectified surface EMG and force components yielded EWA waveforms peaking at time lag (between EMG and force) of 50 ms. The EWA time to peak is shown as a vertical line. C: plots of EWA components against each other shows EWA trajectories in task space, approximately directed along the mechanical action of each muscle. ×, the point along the trajectory when the EWA magnitude peaked.

