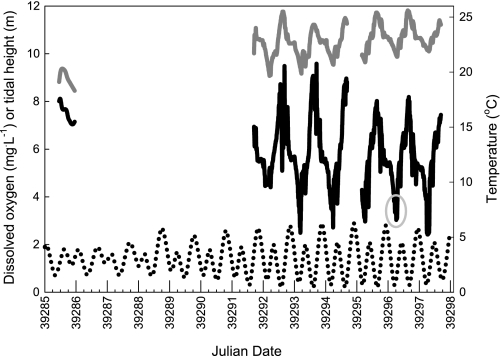
Fig. 1.
Profiles of dissolved oxygen (black line) and water temperature (dark gray line) in relation to tidal height (dotted line) on the Heron Island reef platform for both neap tides (from flood tide through nocturnal low tide on July 22, 2007; left) and spring tides (7 day plot from July 28 to August 3, 2007; right). Severe reductions in dissolved oxygen coincide with nocturnal, spring low tides. Large x-axis ticks indicate midnight; smaller ticks represent 6 h intervals. Light gray circle denotes the time at which the field blood samples were collected. Note that these measurements were taken in Austral winter; oxygen limitation is likely to be even more severe at higher summer temperatures.

