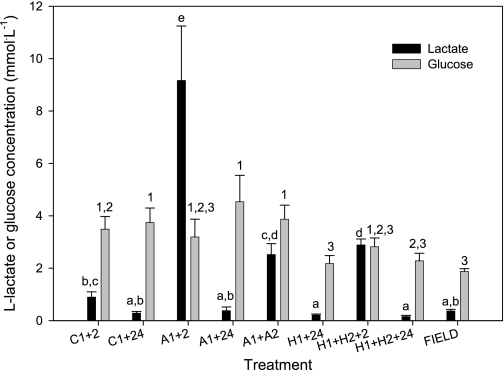
Fig. 4.
Plasma lactate and glucose concentrations in epaulette sharks after exposure to control, anoxic, and hypoxic conditions plus recovery (treatment codes as in text). Different lowercase letters represent statistically distinguishable groups for lactate (Tukey's HSD test); numbers represent statistically distinguishable groups for glucose (Fisher's LSD; see text for details). FIELD samples were collected from individuals on the Heron Island reef platform during a nocturnal, spring low tide. Values are means ± SE from 4–6 individuals per treatment.

