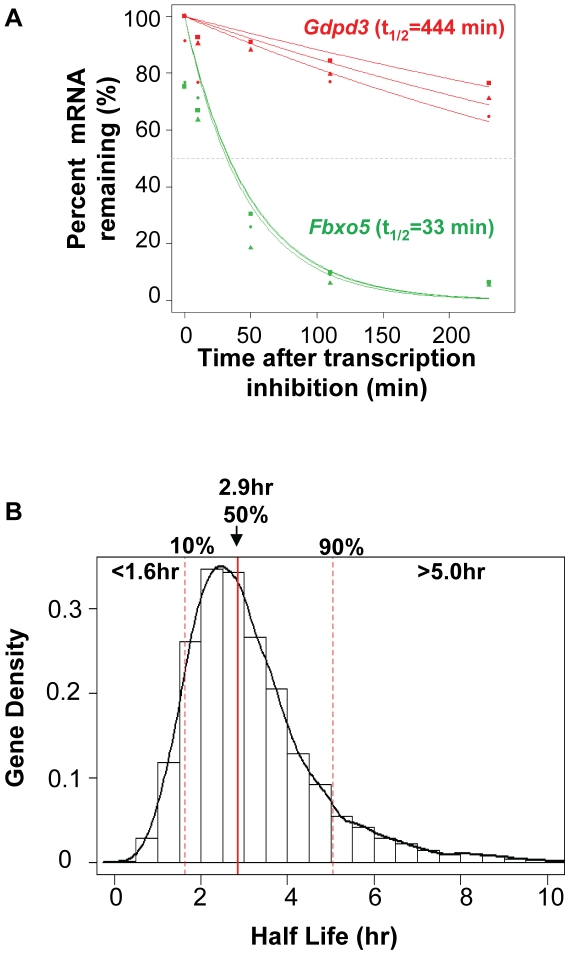
Figure 1. Analysis of mRNA decay rate in C2C12 cells.
(A) Examples of mRNA decay curves were derived by the nonlinear least squares method for a long and a short half life mRNA (see Materials and Methods for details). (B) Distribution of mRNA half lives (see Dataset S1 for the complete list). The 10th-percentile and 90th-percentile values (indicated by red dotted lines) were used to select mRNAs with short and long half lives, respectively. The median value (2.9 hr) is indicated by a red line.

