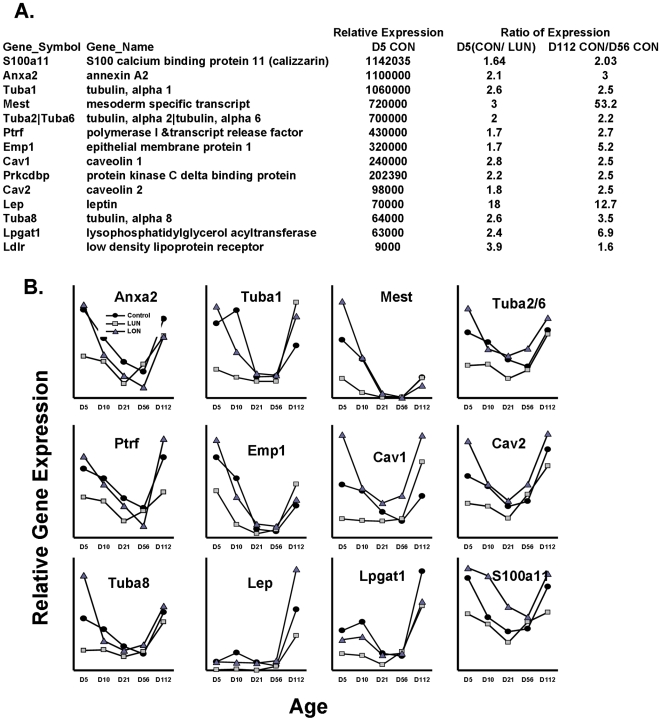
Figure 4. Developmental expression profiles of candidate genes of adipose tissue expansion.
A. Top candidate ATE genes with their expression levels and ratios of induction are given on the right. B. The expression profile of ATE genes during development in mice raised under Control, LUN and LON conditions. Data for the levels of expression were taken directly from normalized gene expression data. Supplemental Figure S2 shows comparisons of data for several genes from microarrays with that obtained with qRT-PCR using TaqMan probes to validate the use of data from microarrays for quantitative estimates of gene expression.

