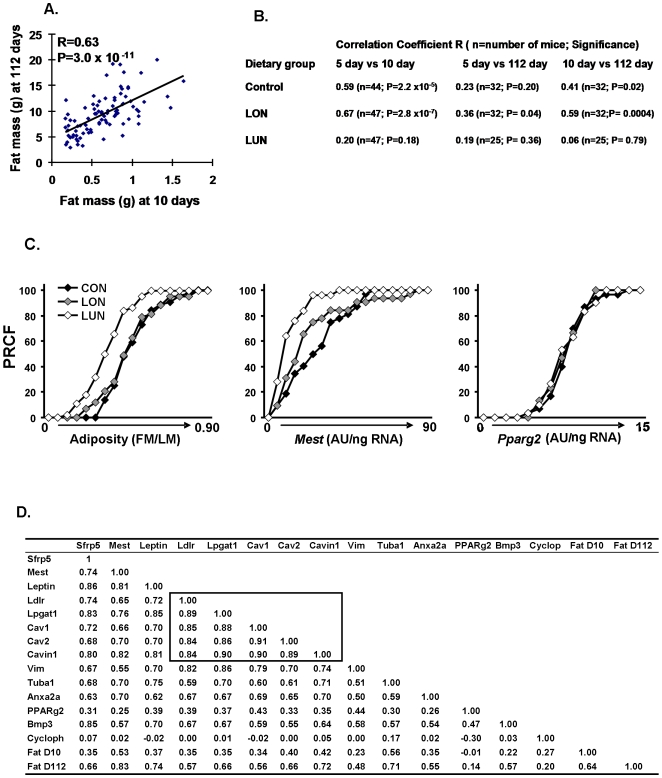
Figure 6. Regression analyses establishes significant associations of fat mass and ATE gene expression at 112 days of age and adiposity at 10 days of age.
A. fat mass at 10 days of age vs fat mass at 112 days of age; B. Regression analyses of fat mass at 5, 10 and 11 days of age under 3 nutritional conditions show that significant associations between adiposity at 5, 10 and 112 days of age depend upon nutritional conditions that promote a positive energy balance during post-natal development. C. Percent relative cumulative frequency (PRCF) p the strong effects of the LUN environment on adiposity and Mest expression, but the lack of effects on PPARγ expression in 112 day-old mice fed a high fat diet for 8 weeks. Data are derived from adiposity and gene expression measurements from at least 25 mice per group. D. A matrix illustrating the correlation coefficients of the major ATE genes and fat mass as well as cyclophilin and PPARγ as control genes at 10 and 112 days of age; Correlations coefficients outlined by the box are unusually strong; N = 83; at R = 0.3, P = 0.01.

