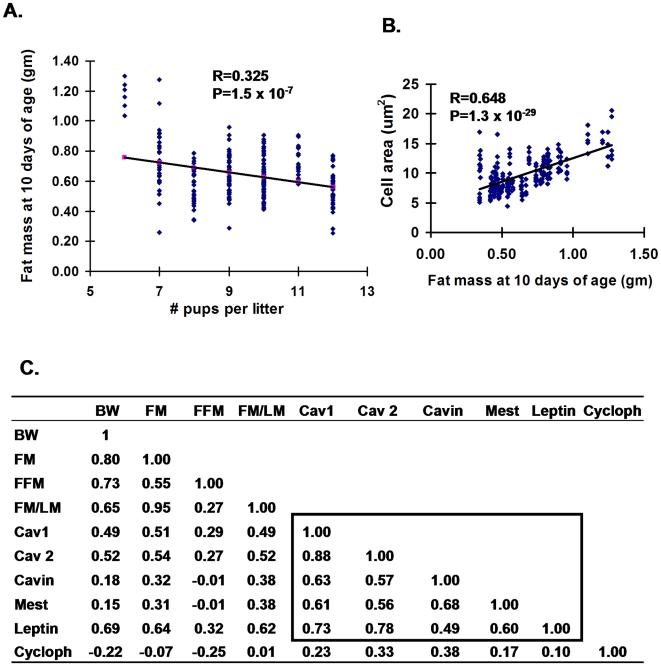
Figure 7. Regression analyses of adiposity and gene expression at 10 days of age.
A. Regression analysis of litter size vs fat mass at 10 days of age (130 female and 119 male mice) indicates a weak association; B. the association between fat mass at 10 days of age vs cell area is very high; Average cell areas in 237 randomly chosen fields from the inguinal fat depots of 48 male mice with varying degrees of adiposity are presented. C. Correlation coefficients indicate strong associations between adiposity at 10 days of age and inguinal fat gene expression at 10 days of age among the ATE genes identified by microarray analysis. The 119 male mice of Cohort III were used for these analyses.

