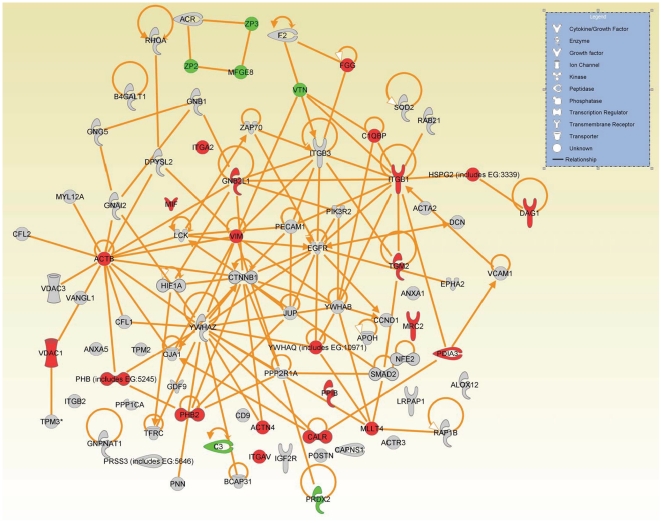
Figure 6. Cell-to-cell signaling and interaction network.
Network generated with proteins involved in cell-to-cell signaling biological process using Ingenuity Pathway Analysis (IPA) as described in materials and methods. Each node represents a protein; proteins in shaded nodes were found in either GV oocyte or cumulus cell or both (see Table 3). Proteins in red and green nodes were higher and lower, respectively, in cumulus cells compared with GV oocytes.

