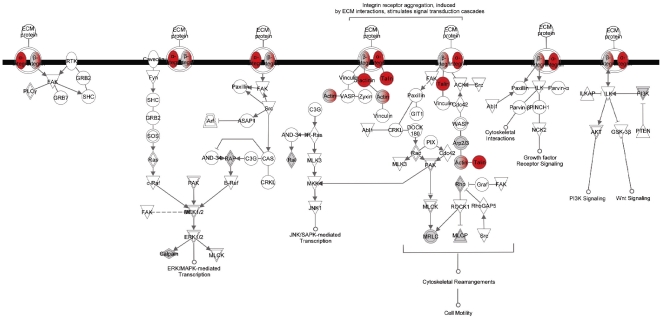
Figure 7. Integrin signaling pathway Integrin signaling pathway generated by the Ingenuity Pathway Analysis (IPA) software.
Integrin and actin cytoskeleton signaling pathways were the top two pathways associated with cell-to-cell signaling. Each node represents a protein; the proteins in shaded nodes in the pathway are identified/relate to an identified protein in the proteomic analysis. While proteins in clear nodes are part of the pathway but have not been identified in the GV oocyte or cumulus datasets. Proteins in red nodes were shown higher expression in cumulus cells compared to GV oocyte.

