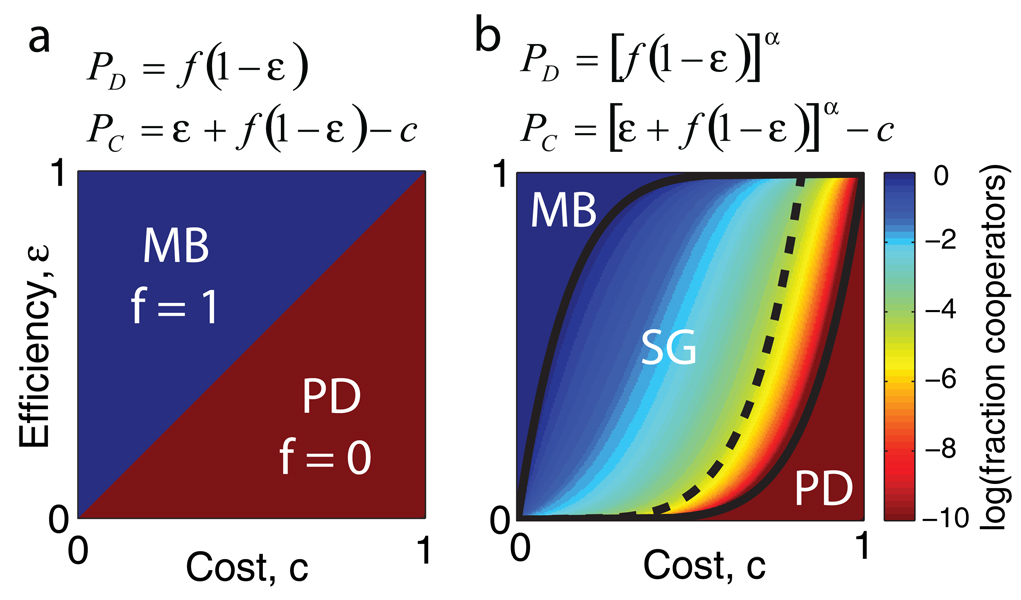
Figure 2. Game theory models of cooperation in sucrose metabolism.
a, Payouts P and resulting phase diagram of the cooperative fraction f at equilibrium in a simple linear model in which cooperation costs c and leads to total benefits of unity which are captured with an efficiency ε. This model leads to fixation of cooperators (f = 1) at low cost and/or high efficiency of capture (ε > c ⇒ MB: Mutually Beneficial Game5) but fixation of defectors (f = 0) for high cost and/or low efficiency of capture (ε < c ⇒ PD: Prisoner’s Dilemma). b, Model of cooperation with experimentally measured concave benefits yields a central region of parameter space that is a snowdrift game (SG), thus explaining the coexistence that is observed experimentally (α = 0.15 in figure, see Supp. Fig. 10). Adding glucose makes the cheaters less reliant on the cooperators, thus reducing the range of parameters in which cooperation can survive (solid to dashed line, see Supp. Fig. 11).

