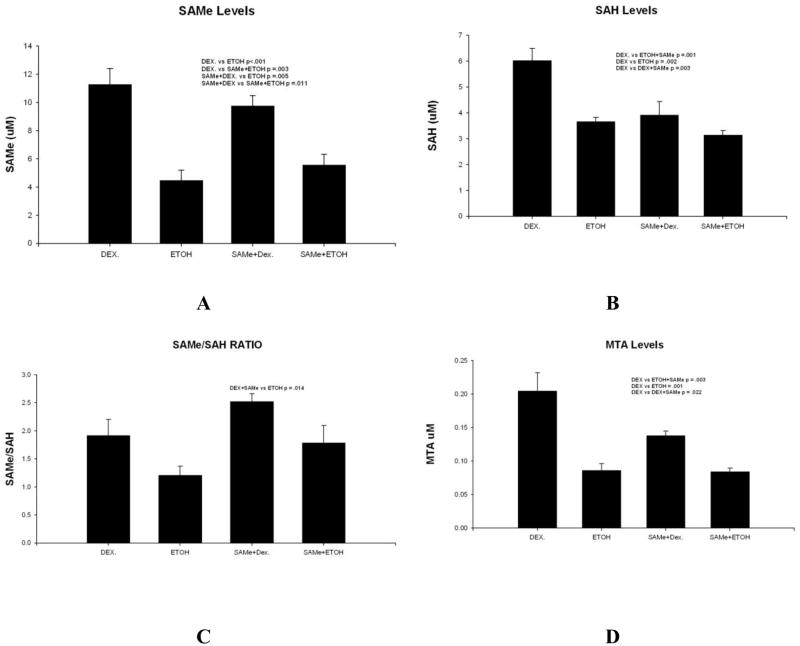
Figure 3.
A. SAMe levels were lower in the livers of rats fed ethanol and rats fed ethanol plus SAMe (Mean±SEM, n=3). B. SAH levels in the liver were lower in the 3 experimental groups of rats compared to the dextrose controls (Mean±SEM, n=3). C. SAM/SAH ratios of the four groups of rats show that ethanol alone caused a decrease in the ratio when compared to rats fed Dextrose plus SAMe (Mean±SEM, n=3).
D. MTA levels were reduced in the livers of the 3 rat treatment groups, compared to the control rats fed dextrose.

