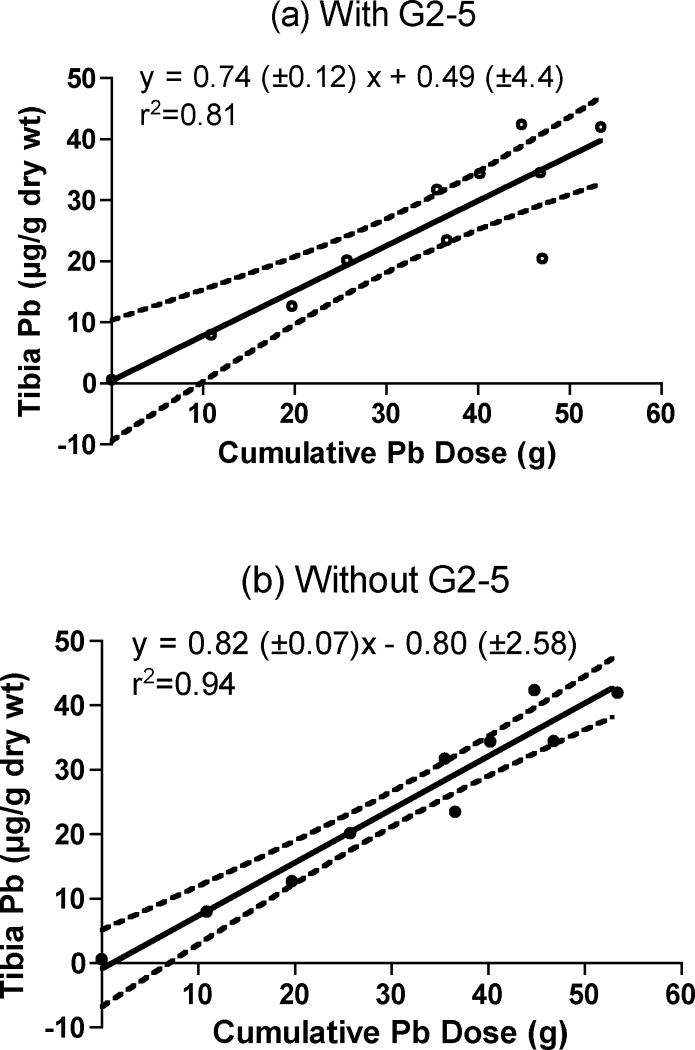
Fig. 1.
Plot of tibia Pb concentration as a function of cumulative Pb dose. Ordinary least squares analysis of the data was conducted (a) for all goats (open circles, n=11), and (b) excluding one goat, G2–5 (closed circles, n=10). The slope and intercepts are shown (±SE), along with the 95% confidence intervals.

