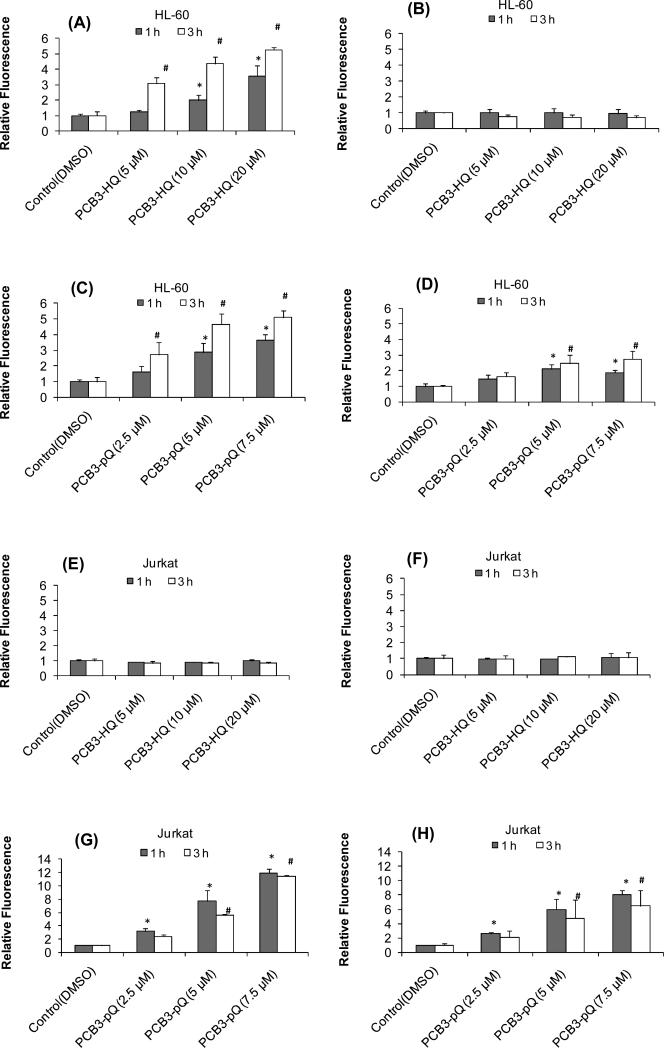
Figure 2.
Intracellular level of ROS measured by DCF fluorescence after exposure to PCB3-HQ for 1h and 3 h in HL-60 cells at (A - D) and Jurkat cells (E – H) at 37°C (graphs in left column) and 6°C (graphs in right column). *, significantly different compared to the 1 h control, P<0.05; # significantly different compared to the 3 h control, p<0.05.

