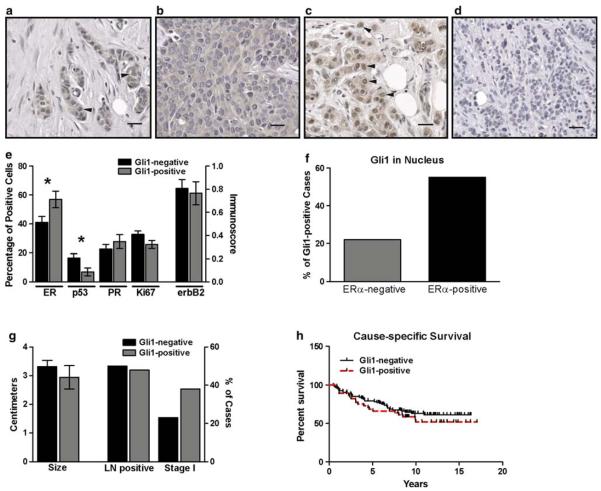
Fig. 3.
Gli1 in ERα-positive and ERα-negative breast cancers. a–d There was variability in the staining pattern of infiltrating ductal carcinomas of the breast for Gli1. In some cancers, expression was both cytoplasmic and nuclear (arrowheads) (a). In others, expression was primarily or exclusively cytoplasmic (b), or primarily nuclear (arrowheads) (c). In 8 cancers, there was no nuclear or cytoplasmic Gli1 expression (d). For a–d, magnification is 200×, scale bar = 40 μM. e Cancers with Gli1 nuclear staining (Gli1-positive, n = 53) and without nuclear staining (Gli1-negative, n = 118) were compared for the percentages of cells positive for ERα, PR, p53, Ki-67 and membrane expression of ErbB2 (immunoscore). Asterisks indicate statistical significance for ERα (P = 0.027) and p53 (P = 0.017). f A comparison of the percentage of cancers which were Gli1-positive among ERα-positive (n = 89) and ERα-negative (n = 60) breast cancers was significantly different (P = 0.033). g A comparison of tumor size and the number of cases with lymph node metastases or in clinical stage I at the time of diagnosis was not different between Gli1-positive and Gli1-negative cancers. h The Kaplan–Meier estimate was used to compare cause-specific survival (i.e., death due to cancer) in women with Gli1-positive (n = 45) and Gli1-negative (n = 94) cancers. The log-rank test indicated there was no significant difference

