
Fig. 5.
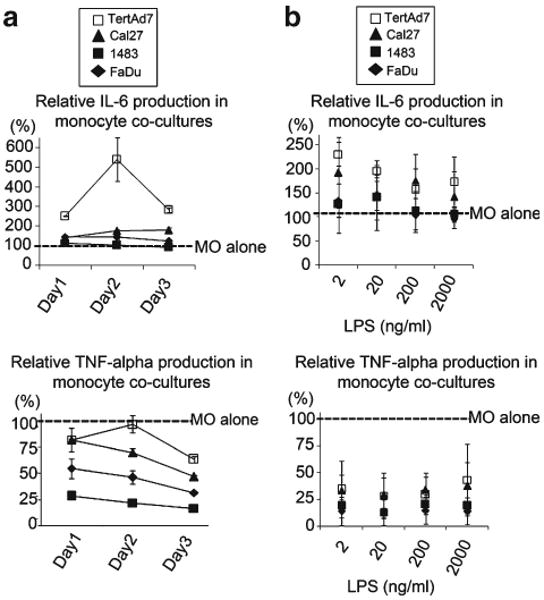
Relative IL-6 and TNF-alpha production with respect to time course (a) and LPS dose titration (b). a Donor 1 monocytes were cultured alone or co-cultured with keratinocytes (TertAd7) or HNSCC cells, and 200 ng/ml LPS was added on day 0. Culture supernatants were collected and analyzed 1, 2 and 3 days after LPS stimulation. LPS-induced IL-6 and TNF-alpha production, respectively, on each day of monocyte co-cultures is shown as percent of that produced in LPS-stimulated monocytes cultured alone. The results are representative of two independent experiments. b Donor 1 monocytes were cultured alone or co-cultured with keratinocytes (TertAd7) or HNSCC cells and stimulated on day 0 with 2, 20, 200 and 2,000 ng/ml LPS. Culture supernatants were collected 3 days after LPS stimulation. LPS-induced IL-6 and TNF-alpha production in monocyte co-cultures is shown relative to corresponding LPS-stimulated monocytes cultured alone. Results shown are from 3 independent experiments.