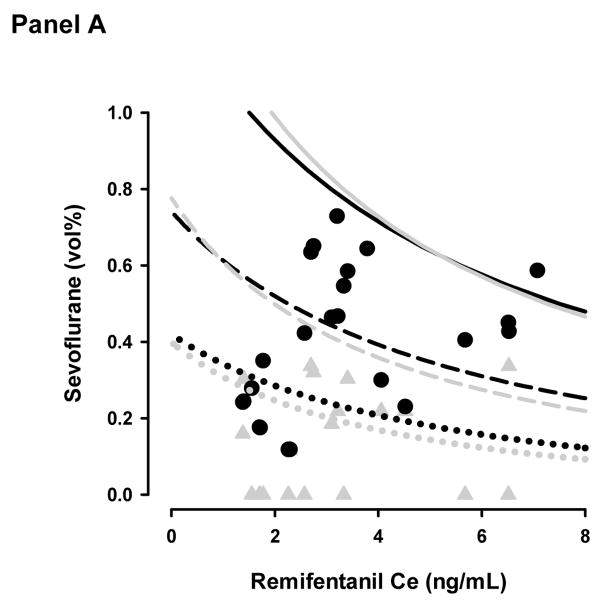
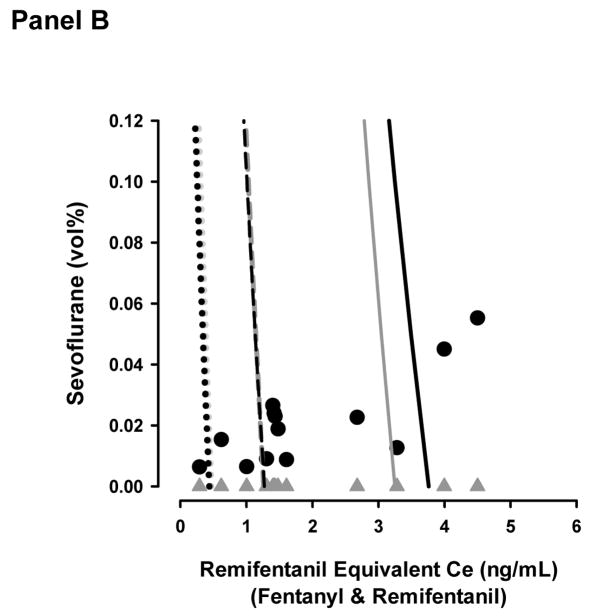
Figure 2.
Topographical plots of model predictions of OAA/S = 1 (Panel A) and lack of response to 30 pounds per square inch of tibial pressure (Panel B). The dotted, dashed, and solid lines represent the 5%, 50%, and 95% model probabilities for the effect-site (black lines) and end-tidal (grey lines) models. The black circles and grey triangles represent the remifentanil-sevoflurane concentration pairs where patients emerged from anesthesia (Panel A) or required additional analgesia in the recovery room (Panel B) for the effect-site and end-tidal models respectively.


