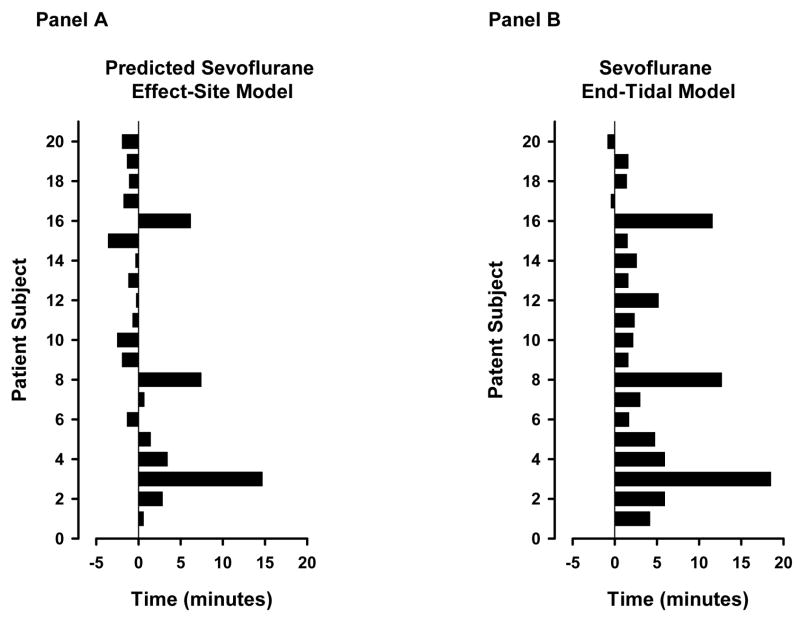
Figure 4.
Time from the 50% model prediction for unresponsiveness to the time of the observed return of responsiveness for the effect-site based (Panel A) and end-tidal based (Panel B) models. After termination of the anesthetic, the model predicted probability of unresponsiveness rapidly decreased over time. A negative, zero or positive number on the horizontal axis indicates that the observed return of responsiveness occurred prior to, exactly at, or after the 50% probability of unresponsiveness. The vertical axis represents each subject.

