
Figure 3.
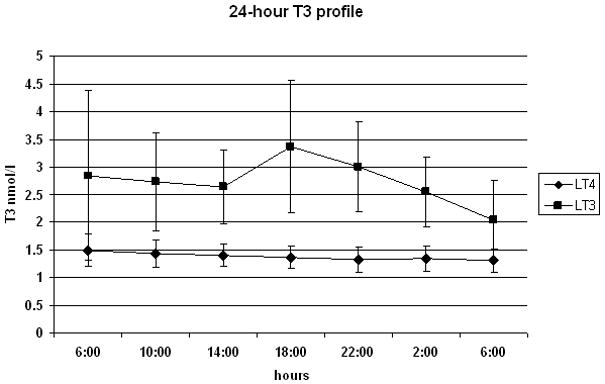
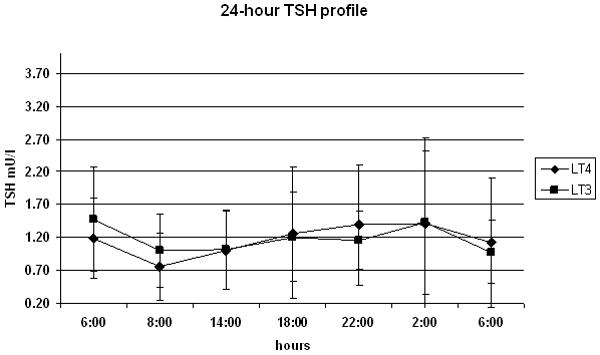
24-hour profile of total T3 levels (panel A) and TSH (panel B) on ◆ lT-3 and (●) l-T4 thyroid hormone replacement therapy. Samples were obtained at 4-hour intervals, except for the second TSH time-point where the time 0 TRH stimulation test (08:00) was substituted for the 10:00 time-point to avoid the artifact of the TRH-stimulated rise in TSH.