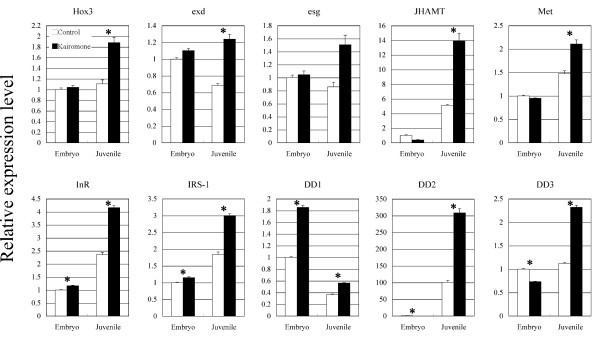
Figure 2.

Relative expression levels of JHAMT, Met, InR, IRS-1, Hox3, exd, esg, DD1, DD2 and DD3 in stage 4 embryos and the first-instar juveniles treated with kairomone and control media, analyzed by real-time quantitative PCR. DD1 showed higher levels of expression after exposure to kairomone medium (black) than in control medium (white) during embryonic development. Other genes showed higher levels of expression after exposure to the kairomone medium than in the control during juvenile development. Y-axes indicate relative expression levels normalized by comparison with GAPDH expression (internal control gene). Technical triplicates were performed for all reactions. Bars indicate standard errors. Asterisks indicate significant differences (P < 0.05, based on [57]).
