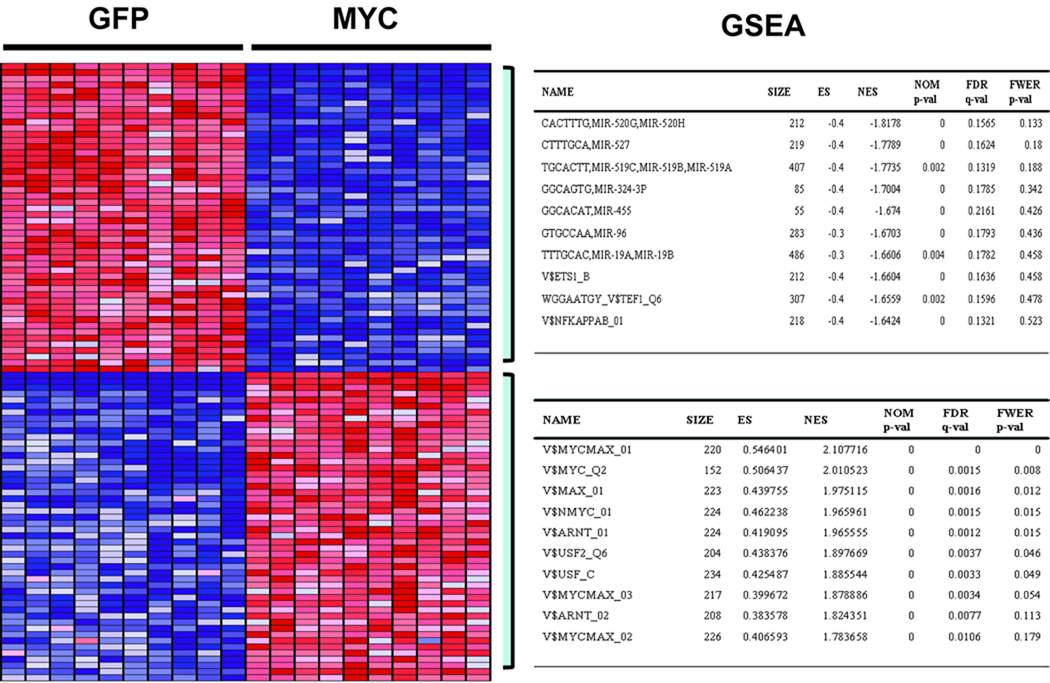
Fig. 1.
Representative heatmap of top 50 genes that are differentially regulated by Myc as identified by the Gene Set Enrichment Analysis (GSEA). The tables on the right panel summarize top 10 results obtained through the GSEA analysis. Each column on the heatmap represents replicate samples of designated biological status (Myc vs. GFP control), with rows representing individual genes. Red indicates activation, while the blue repression. The top table on the right panel summarizes top10 GSEA results for significantly enriched transcription factor (TF) or microRNA target site motifs of Myc repressed genes while the bottom table that of the activated genes.

