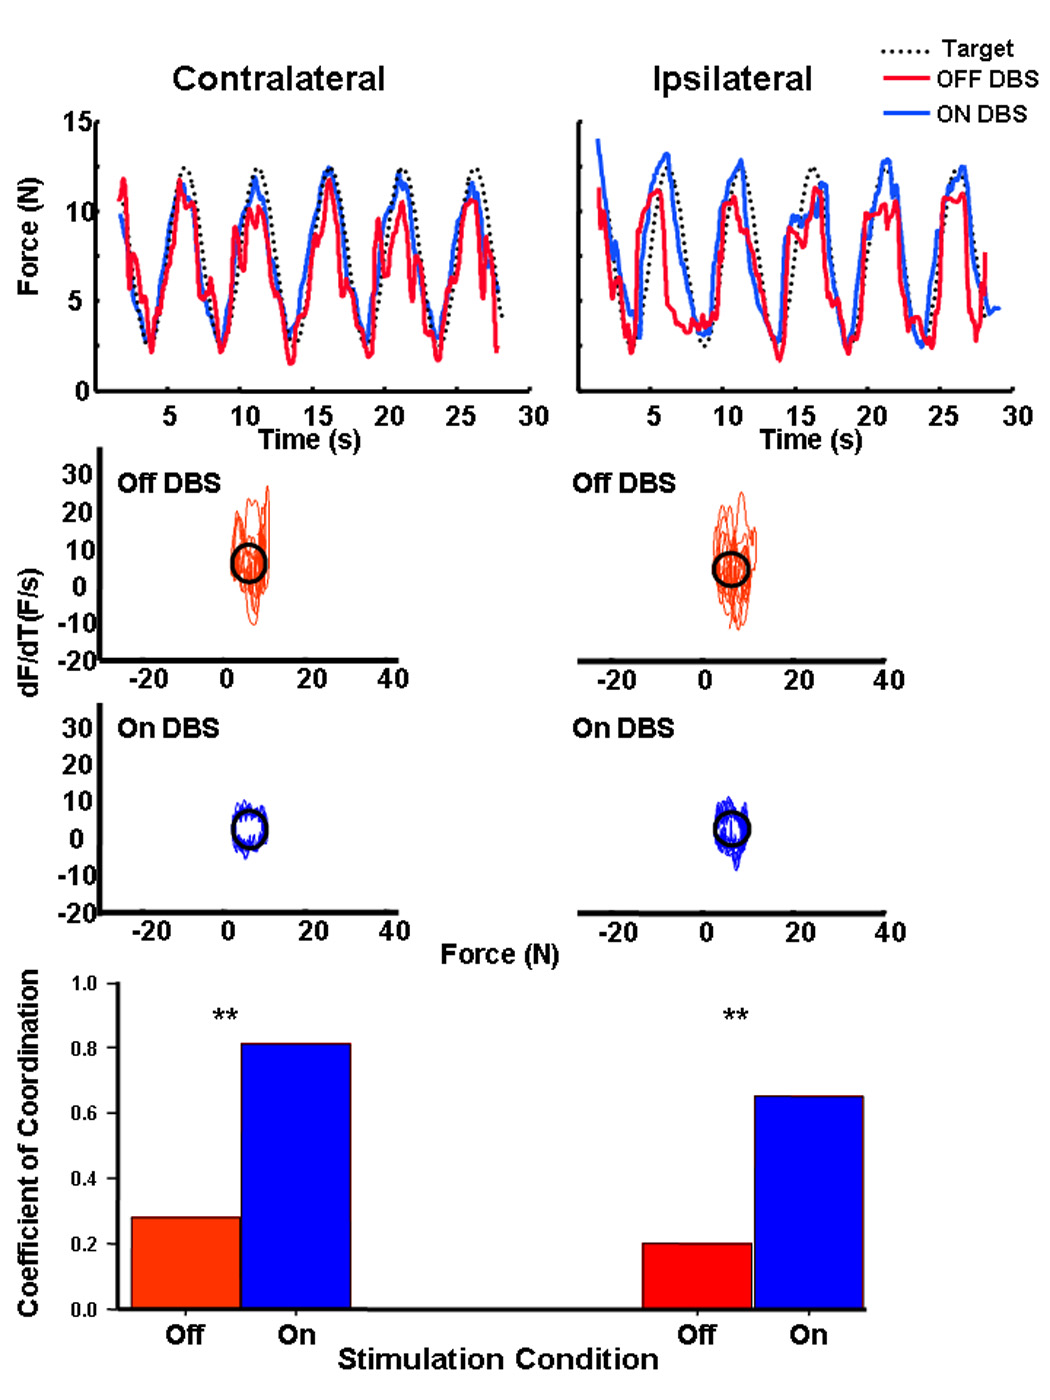
Figure 1.

Representative force-tracking performance for one patient for the limb contralateral and ipsilateral to the DBS electrode while Off (red) and On(blue) DBS. The middle plots depict the rate of force produced as a function of actual force to assess force variability during tracking for data provided above. Perfect performance would yield a circle. Perfect tracking of the sine wave would result in a circle. The lower plots represent the group average coefficient of coordination for each limb while Off (red bar) and On (blue bar) stimulation.
